
It’s season planning time again. Wow, this year seems like it went really fast! This is the time of year arts marketers are reviewing last years’ campaigns and media channels and making decisions on how and where to invest their marketing budgets. This is a critical task for any advertiser as the number one way to increase return on ad spend is to ensure that your budgets are effectively allocated to the desired target audience.
Just published news from the Center for Media Research and the Pew Research Center may make this year’s decisions more complicated and difficult than ever before. According to a new, eMarketer report published by the Center for Media Research “US Time Spent with Media”, US adults will squeeze an average of 12 hours, 5 minutes per day of media usage into their waking hours this year. Thanks to media multitasking, this represents nearly an hour more than the average in 2011. While mobile devices enable people to consume media content anywhere at any time, the numbers suggest a saturation point is near as the majority of consumers own smartphones. Increased time spent with one medium will tend to come at the expense of time spent with another.
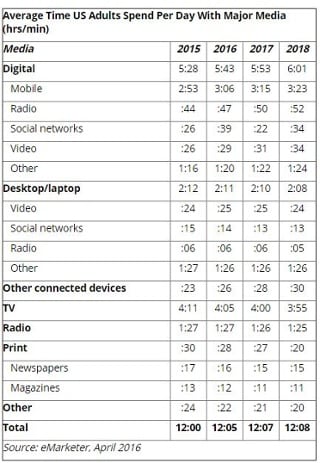
The chart below details consumer’s current media consumption as well as where it is heading. It’s clearly a mobile world with digital, social, mobile all forecasted to continue to grow and take time away from desktops and traditional media like TV, Radio and Print. Print is showing the greatest decline with a loss of 50% of consumers time over 2015-2016.
The Pew Research Center for Journalism and Media just published data highlighting similar shifts in media consumption and they specifically highlighted challenges within print.
According to Pew, weekday circulation fell 7% and Sunday circulation fell 4%, both showing their greatest declines since 2010. At the same time, advertising revenue experienced its greatest drop since 2009, falling nearly 8% from 2014 to 2015. Fully one-fourth of advertising revenue now comes from digital advertising, but not because of growth in that area: Digital advertising revenue fell 2% in 2015. It’s just that non-digital advertising revenue fell more, dropping 10% in 2015. In 2014, the latest year for which data was available, newsroom employment also declined 10%, more than in any other year since 2009.
These levels of shifts in media consumption are unprecedented and can be very difficult to navigate for marketers. While this is national consumer data, your patrons are likely to be more educated and affluent than average which could mean your patrons’ shift in media consumption may be even greater. Educated and affluent consumers tend to be the early adopters of technology. They use devices and technology to connect, add convenience and better their lives. They likely own a number of devices like smartphones, tablets, laptops, desktops and even smart tvs. They may subscribe to Netflix, Pandora or Spotify and even have devices like AppleTV and Roku.
Here are some tips for season planning this year:
Align Media Investments to Media Consumption
Evaluate how your media investments align to consumer media consumption. Referencing the data above, if consumers spend 7% of their time with print, what is an appropriate percentage of your budget to invest in print? Likewise, if consumers are increasingly online what is an appropriate investment in online? This alignment is the #1 way to increase your organization’s return on ad spend.
Avoid Contracts
This data shows that media consumption will continue to shift. Avoid contracts that lock your dollars into any media. You may feel the need to reallocate mid season and contracts may prevent you from doing what’s in the best interest of your organization. Contracts only benefit the other party so avoid these at all costs.
Measure the Unmeasurable
Where direct mail, email and digital are highly measurable, print, TV and radio are not. However, you can use your Google Analytics to measure print and TV. For example, look at this past year’s marketing plan and select a few dates where you ran print ads. In Google Analytics, filter by the geography of the newspaper’s distribution, and filter out all sources except organic, paid search and direct. Now you are looking for a spike in these days or days when you did not run a newspaper ad. Did you see a spike? How many visitors were there? Calculate the cost per unique visitor and compare to alternative channels.
Consider Starting Anew
Ask yourself this, if you were to start your arts organization today, what media would you use? Where would you invest your first dollars? In print or Facebook? This is a great planning exercise and can really help arts organizations move away from the legacy media mix that has lost its effectiveness.
Think Ahead of the Curve
Looking at this data, start thinking about where it is all going. Evolving your media mix is evolution, not revolution. The steps you begin today will support your marketing efforts tomorrow. Be innovative, and learn how to get ahead of these shifts.
For deeper insights and tips on season planning for arts organizations watch this recorded webinar: Media Planning In a Digital Age